> ## Documentation Index
> Fetch the complete documentation index at: https://docs.nofire.ai/llms.txt
> Use this file to discover all available pages before exploring further.
# Root Cause Analysis
> Find out why something broke, in minutes, not hours.
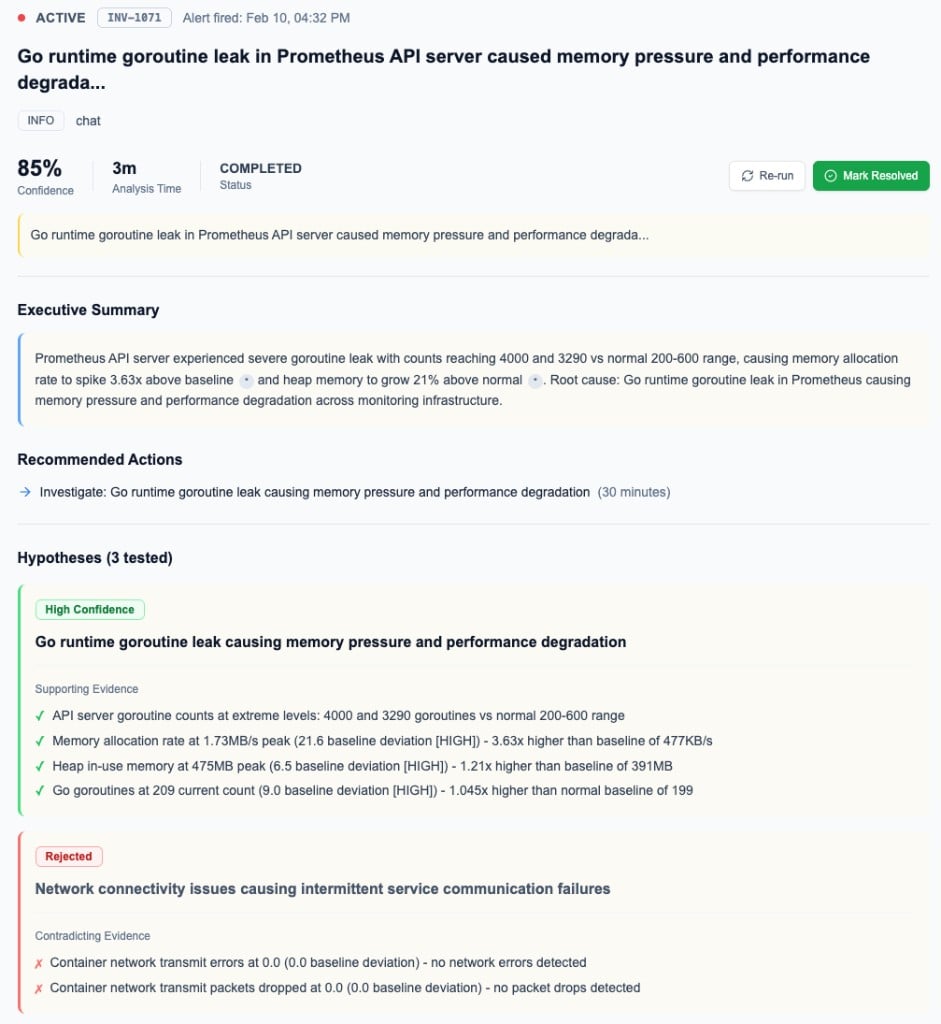
When a service goes down or degrades, finding the cause means checking metrics, digging through logs, reading traces, cross-referencing code changes, and scanning infrastructure events, all across multiple tools. NOFire does all of that in one step and tells you what happened and why.
**Typical impact:** MTTR reduces from hours to \~5 minutes. Investigation stays in one thread instead of 15-30 tool switches.
## What You Get
You get an explanation: what broke, why, and what changed before it happened.
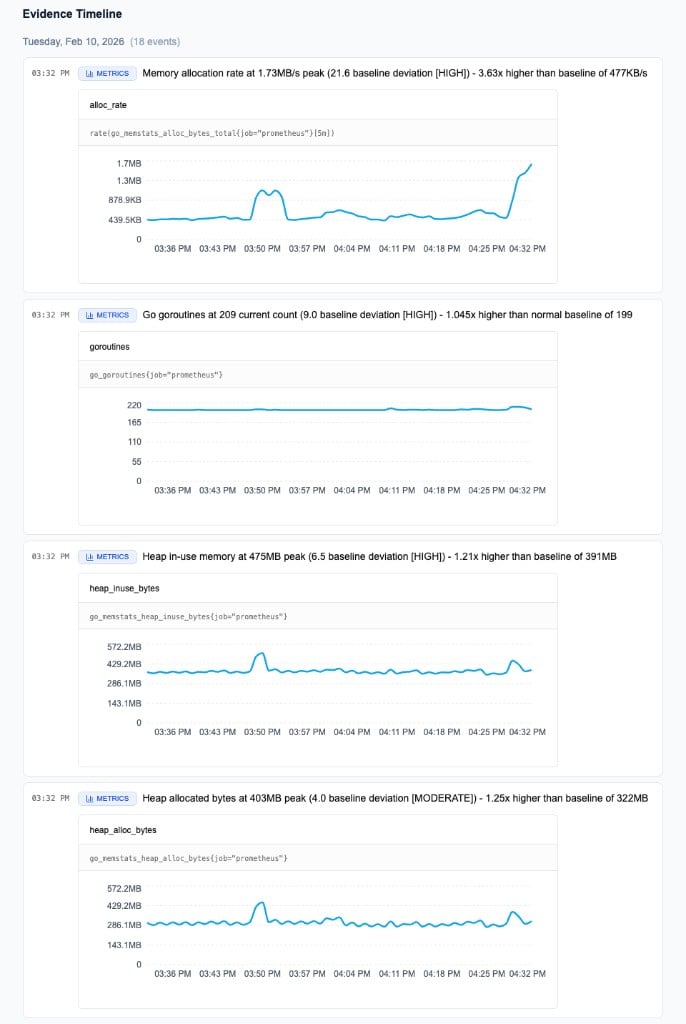
NOFire queries metrics, logs, traces, infrastructure events, and code changes. You don't have to open each tool.
Recent PRs and commits are automatically fetched for the incident window. File hotspots with incident history are highlighted.
See the chain of events that led to the failure: config change, pod restart, error spike.
 ## How to Use It
Ask in plain language. NOFire pulls from every connected source automatically.
```
@NOFire AI why is checkout erroring?
```
```
@NOFire AI what caused the latency spike in payment at 14:30?
```
```
@NOFire AI why did cart start failing after the 15:00 deploy?
```
```
@NOFire AI which code change caused the regression in the recommendation service?
```
```
@NOFire AI investigate the outage between 09:00 and 11:00 this morning
```
## Before and After
**Without NOFire**
1. Alert fires
2. Open Grafana. Metrics spiking, no obvious cause
3. Dig through Loki. Hundreds of log lines
4. Open Jaeger. Find slow traces, try to correlate
5. Check infrastructure events. Spot a pod restart
6. Search GitHub. Find the deployment that happened before
7. 45+ minutes later: root cause identified
**With NOFire**
1. Alert fires. Ask `why is checkout erroring?`
2. NOFire checks metrics, finds error logs, spots a pod OOMKill, ties it to a deployment 10 min prior, pulls the PR diff
3. Response: "checkout started erroring at 14:32 after a deployment at 14:22. The new version increased memory consumption via a changed query in `checkout/db/queries.py`, causing pods to be OOMKilled. 3 of 5 replicas are down."
4. Minutes to root cause, clear next action
**Without NOFire**
1. You deployed 20 minutes ago
2. Latency is slightly elevated. Is it your change?
3. Open Grafana, compare before/after
4. Check logs for errors. Nothing obvious
5. Pull up the PR diff, look for suspect code
6. Ask a teammate. They're busy
7. Either roll back out of caution or wait and hope
**With NOFire**
1. Ask `latency on auth-service is up since my deploy at 15:00 — is it my change?`
2. NOFire checks the metric trend, correlates with the deployment timestamp, inspects the diff
3. Response: "Latency increased \~18% after the 15:00 deployment. The change to `auth/middleware/rate_limiter.py` added a synchronous Redis call in the request path. P99 is now 340ms vs 288ms baseline."
4. You know what to fix without involving anyone else
## What NOFire Checks
For every investigation, NOFire queries all connected sources:
* **Metrics**: error rates, latency, saturation, resource usage
* **Logs**: error patterns, stack traces, frequency changes
* **Traces**: slow spans, error propagation across services
* **Infrastructure events**: pod restarts, deployments, scaling, config changes
* **Code changes**: recent PRs and commits, changed files, file hotspots with incident history
* **Dependencies**: which downstream services were affected
The more sources you have connected, the more complete the picture.
## How to Use It
Ask in plain language. NOFire pulls from every connected source automatically.
```
@NOFire AI why is checkout erroring?
```
```
@NOFire AI what caused the latency spike in payment at 14:30?
```
```
@NOFire AI why did cart start failing after the 15:00 deploy?
```
```
@NOFire AI which code change caused the regression in the recommendation service?
```
```
@NOFire AI investigate the outage between 09:00 and 11:00 this morning
```
## Before and After
**Without NOFire**
1. Alert fires
2. Open Grafana. Metrics spiking, no obvious cause
3. Dig through Loki. Hundreds of log lines
4. Open Jaeger. Find slow traces, try to correlate
5. Check infrastructure events. Spot a pod restart
6. Search GitHub. Find the deployment that happened before
7. 45+ minutes later: root cause identified
**With NOFire**
1. Alert fires. Ask `why is checkout erroring?`
2. NOFire checks metrics, finds error logs, spots a pod OOMKill, ties it to a deployment 10 min prior, pulls the PR diff
3. Response: "checkout started erroring at 14:32 after a deployment at 14:22. The new version increased memory consumption via a changed query in `checkout/db/queries.py`, causing pods to be OOMKilled. 3 of 5 replicas are down."
4. Minutes to root cause, clear next action
**Without NOFire**
1. You deployed 20 minutes ago
2. Latency is slightly elevated. Is it your change?
3. Open Grafana, compare before/after
4. Check logs for errors. Nothing obvious
5. Pull up the PR diff, look for suspect code
6. Ask a teammate. They're busy
7. Either roll back out of caution or wait and hope
**With NOFire**
1. Ask `latency on auth-service is up since my deploy at 15:00 — is it my change?`
2. NOFire checks the metric trend, correlates with the deployment timestamp, inspects the diff
3. Response: "Latency increased \~18% after the 15:00 deployment. The change to `auth/middleware/rate_limiter.py` added a synchronous Redis call in the request path. P99 is now 340ms vs 288ms baseline."
4. You know what to fix without involving anyone else
## What NOFire Checks
For every investigation, NOFire queries all connected sources:
* **Metrics**: error rates, latency, saturation, resource usage
* **Logs**: error patterns, stack traces, frequency changes
* **Traces**: slow spans, error propagation across services
* **Infrastructure events**: pod restarts, deployments, scaling, config changes
* **Code changes**: recent PRs and commits, changed files, file hotspots with incident history
* **Dependencies**: which downstream services were affected
The more sources you have connected, the more complete the picture.
 ## Common Use Cases
Start broad and let NOFire narrow it down.
```
@NOFire AI what's causing the current incident?
```
Then follow up:
```
@NOFire AI dig deeper into the database connection errors
```
```
@NOFire AI which recent code changes correlate with the payment service errors?
```
NOFire fetches PRs in the incident window, identifies changed files, and highlights file hotspots, files that have been involved in past incidents.
```
@NOFire AI give me the full root cause analysis for the incident between 14:00 and 16:00 yesterday
```
Returns a structured sequence of events ready to paste into your postmortem doc.
```
@NOFire AI several services spiked at 09:15 — what was the common cause?
```
NOFire checks shared dependencies and upstream services to find what triggered cascading failures.
## Available in
* **Slack**: `@NOFire AI` in any channel
* **Chat dashboard**: [my.nofire.ai](https://my.nofire.ai)
* **IDE (MCP)**: investigate while coding
## Getting Started
RCA works best when metrics, logs, traces, and infrastructure events are all connected. [Connect Grafana →](/monitoring/grafana)
Code-aware investigation requires VCS access. [Connect GitHub →](/git/github-app)
Edge provides Kubernetes events and service dependency data. [Install Edge →](/edge/installation)
See what changed before the incident
Understand alerts when they fire, clean them up when they don't
## Common Use Cases
Start broad and let NOFire narrow it down.
```
@NOFire AI what's causing the current incident?
```
Then follow up:
```
@NOFire AI dig deeper into the database connection errors
```
```
@NOFire AI which recent code changes correlate with the payment service errors?
```
NOFire fetches PRs in the incident window, identifies changed files, and highlights file hotspots, files that have been involved in past incidents.
```
@NOFire AI give me the full root cause analysis for the incident between 14:00 and 16:00 yesterday
```
Returns a structured sequence of events ready to paste into your postmortem doc.
```
@NOFire AI several services spiked at 09:15 — what was the common cause?
```
NOFire checks shared dependencies and upstream services to find what triggered cascading failures.
## Available in
* **Slack**: `@NOFire AI` in any channel
* **Chat dashboard**: [my.nofire.ai](https://my.nofire.ai)
* **IDE (MCP)**: investigate while coding
## Getting Started
RCA works best when metrics, logs, traces, and infrastructure events are all connected. [Connect Grafana →](/monitoring/grafana)
Code-aware investigation requires VCS access. [Connect GitHub →](/git/github-app)
Edge provides Kubernetes events and service dependency data. [Install Edge →](/edge/installation)
See what changed before the incident
Understand alerts when they fire, clean them up when they don't