> ## Documentation Index
> Fetch the complete documentation index at: https://docs.nofire.ai/llms.txt
> Use this file to discover all available pages before exploring further.
# Service Health
> Ask how a service is doing and get a live metrics view, directly in chat.
Live metric panels are available in the **Chat dashboard** at [my.nofire.ai](https://my.nofire.ai). Slack and MCP return text-based health summaries.
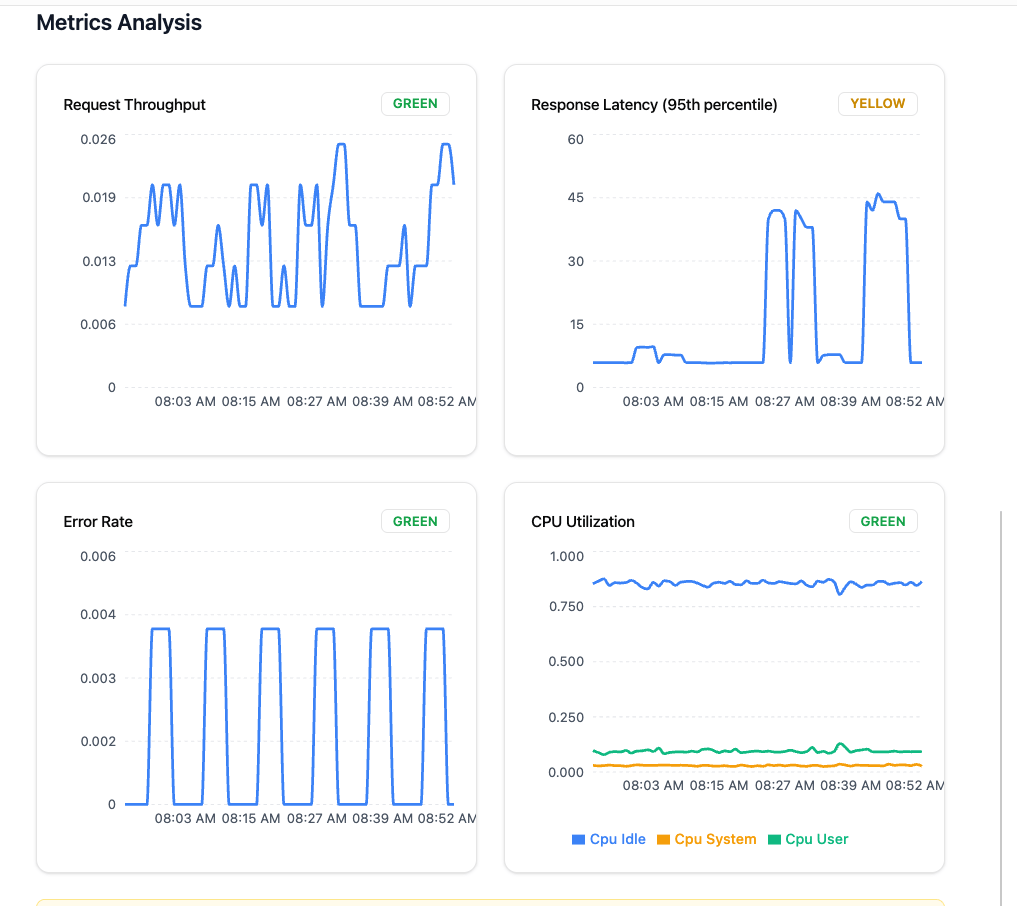
Instead of opening Grafana and finding the right dashboard, ask about a service and get a live metrics view rendered inline. Request throughput, latency percentiles, error rate, resource utilization, each with a health status indicator.
## What You Get
Metric panels render inline: throughput, latency, error rate, and CPU, each with a GREEN / YELLOW / RED status.
Ask about any service and any time range. NOFire queries your connected metrics sources and renders the view.
Health indicators on each panel so you can spot what needs attention immediately.
See something off? Ask about it in the same thread and NOFire switches into investigation mode.
 ## How to Use It
In the Chat dashboard at [my.nofire.ai](https://my.nofire.ai):
```
show me the health of the checkout service
```
```
how is payment service doing right now?
```
```
show me latency and error rate for cart in the last hour
```
```
give me a metrics overview for all services in the production namespace
```
In **Slack** or **MCP**, the same questions return text-based health summaries with key metric values.
## Follow Up in the Same Thread
After seeing the panels, keep going:
```
show me the last 3 hours instead
```
```
why is the response latency panel yellow?
```
```
add memory usage to this view
```
Asking "why" on a yellow or red panel transitions directly into an investigation.
## Common Use Cases
```
show me the health of payment before I deploy
```
Quick sanity check that surfaces existing issues before you push a new change.
```
show me yesterday's metrics overview for production services
```
A shared view of what happened during the previous shift.
```
show me error rate and latency for checkout since the 15:00 deploy
```
Confirm nothing regressed without switching tools.
See a YELLOW or RED panel and follow up:
```
why is response latency elevated?
```
NOFire goes from health view into full root cause analysis.
## Getting Started
Connect at least one metrics source.
Self-hosted Prometheus
Grafana with Prometheus datasource
Distributed tracing
Logs and search
## How to Use It
In the Chat dashboard at [my.nofire.ai](https://my.nofire.ai):
```
show me the health of the checkout service
```
```
how is payment service doing right now?
```
```
show me latency and error rate for cart in the last hour
```
```
give me a metrics overview for all services in the production namespace
```
In **Slack** or **MCP**, the same questions return text-based health summaries with key metric values.
## Follow Up in the Same Thread
After seeing the panels, keep going:
```
show me the last 3 hours instead
```
```
why is the response latency panel yellow?
```
```
add memory usage to this view
```
Asking "why" on a yellow or red panel transitions directly into an investigation.
## Common Use Cases
```
show me the health of payment before I deploy
```
Quick sanity check that surfaces existing issues before you push a new change.
```
show me yesterday's metrics overview for production services
```
A shared view of what happened during the previous shift.
```
show me error rate and latency for checkout since the 15:00 deploy
```
Confirm nothing regressed without switching tools.
See a YELLOW or RED panel and follow up:
```
why is response latency elevated?
```
NOFire goes from health view into full root cause analysis.
## Getting Started
Connect at least one metrics source.
Self-hosted Prometheus
Grafana with Prometheus datasource
Distributed tracing
Logs and search