

Before the next deploy
Service topology, dependencies, and known failure modes inform blast radius and deploy risk.
When something breaks
NOFire AI applies your runbooks and past incidents at the start of the evidence analysis.
After it is resolved
What the investigation concluded is drafted for review, so the next one is faster.
Where entries live
An entry carries the entities it affects, so it is read where the work happens.- A service doc is read on the service record, beside the graph, the dependencies, and the change timeline for that service. That is the wiki per service.
- Everything else is browsable in the Knowledge library, filtered by category or by affected entity.
What to write
Write what a senior engineer already knows but no tool can discover: your cluster names, how services connect, which signals are noise, and what the last incident taught you. Before your next on-call rotation, these entries make every query NOFire runs more accurate. Start with these:- One service doc per critical service: owner, dependencies, log query template, known failure modes
- Your cluster and namespace layout. NOFire needs this to query the right place.
- Any runbook for a failure mode that has happened more than once
- Observability blind spots: services with no traces, noisy log sources, unreliable metrics
Categories
Each entry belongs to one of five categories. The category tells NOFire how to interpret what you have written and when to apply it. Find the Knowledge Library in Settings → Knowledge Library.
Write entries in Markdown. Use Affected entities to scope an entry to specific services. It is a free-text tag field on the new item form where you type service or component names. NOFire prioritizes those entries when analyzing an issue with that service.
Service doc
Service doc
Facts about a service: what it does, who owns it, how it connects to other services, where its logs are, and known failure modes. This is the most useful category to start with. NOFire applies it any time it is investigating that service.Good to include: repo, team, SLOs, dependencies, log query templates, known failure modes, investigation guidance specific to this service.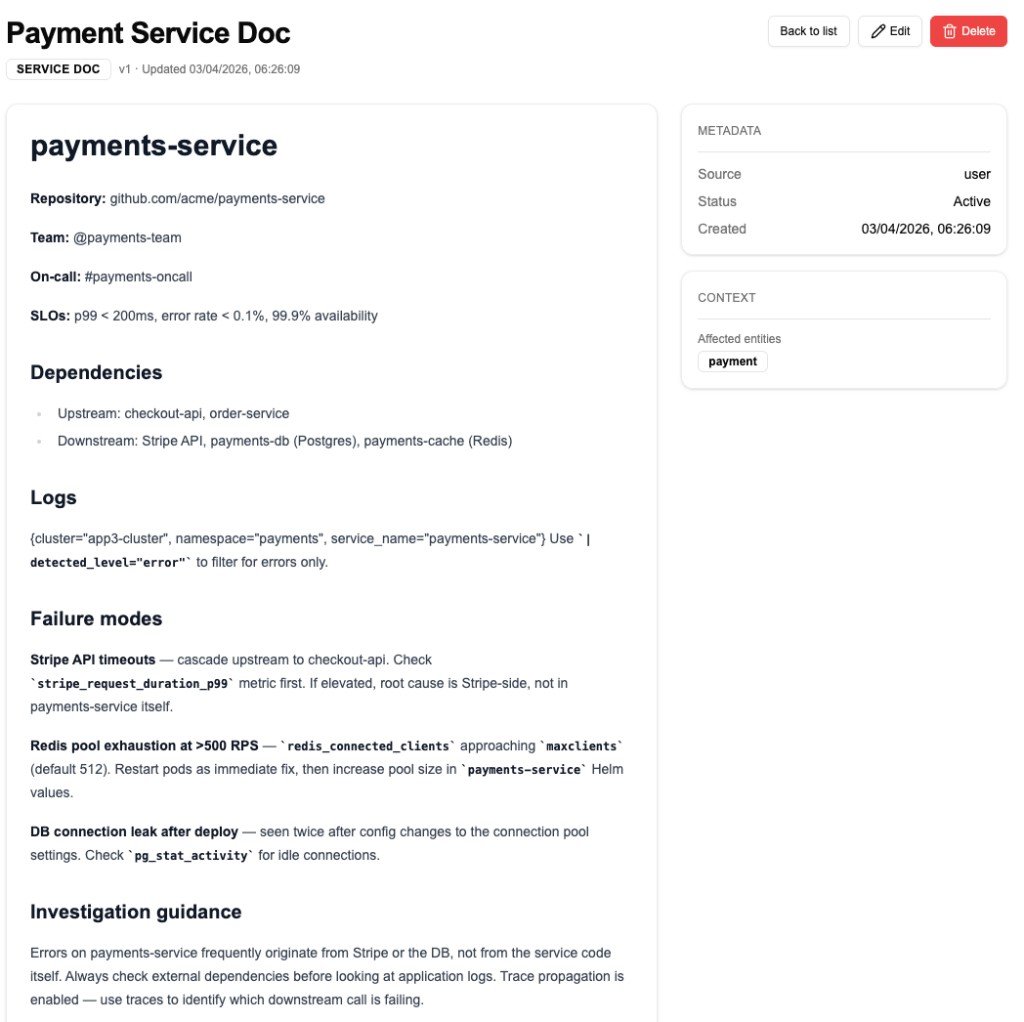
Runbook
Runbook
Step-by-step diagnosis and resolution for a specific, known failure mode. NOFire uses these when the investigation points to a pattern your team has handled before.Good to include: what triggers this, how to check it, exact commands or queries to run, fix steps, and what to watch after the fix.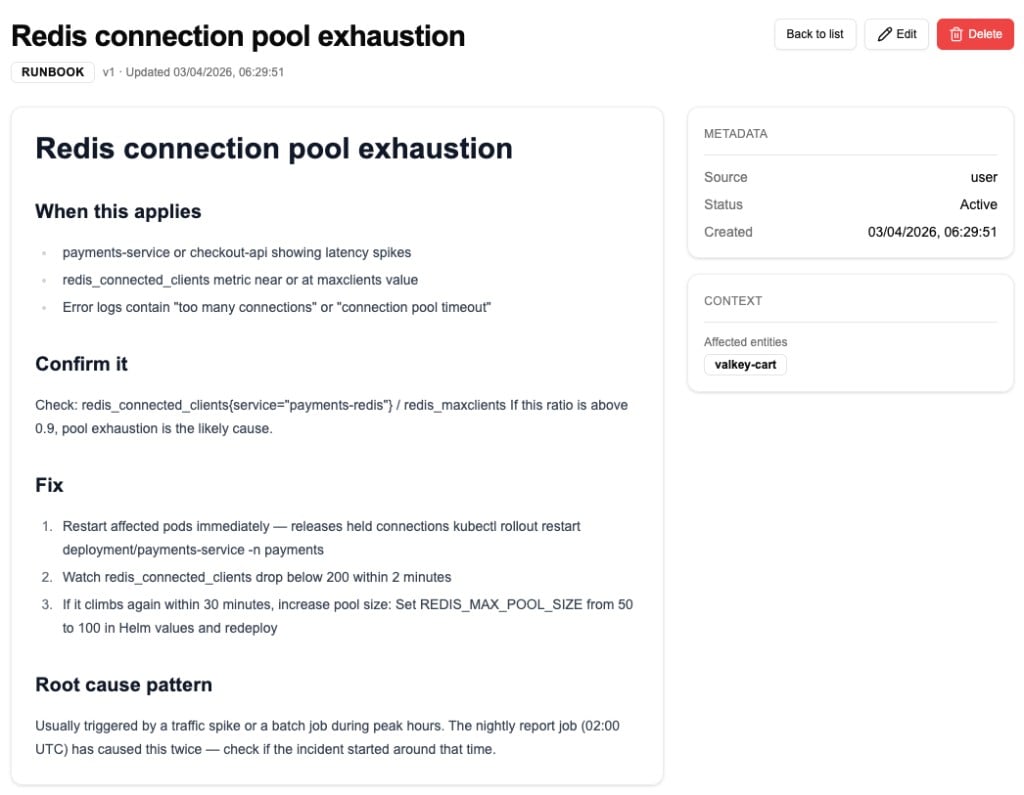
Incident summary
Incident summary
A record of a past incident: what broke, why, and how it was resolved. NOFire uses these to recognize recurring patterns and avoid re-investigating what your team has already solved.Good to include: date, what failed, root cause, how it was found, resolution, and what to watch for next time.
Dashboard guidance
Dashboard guidance
Notes on how to read your dashboards: which panels matter, what thresholds are significant, and what patterns are expected noise vs. real signals.Good to include: dashboard name and link, which panels to look at first, known false positives, expected periodic spikes.
Investigation pattern
Investigation pattern
Non-obvious approaches that have worked in your environment: how signals relate to each other, which dependencies are high-risk, and where your observability has blind spots.Good to include: which service to check first for a given symptom, known blind spots, multi-service correlation patterns, services where alert signals are misleading.
Seed it from past postmortems
If your team has been running postmortems in Slack, NOFire can scan those channels and extract what was learned: past root causes, resolution steps, recurring failure modes. NOFire adds them to the library automatically. This gives you years of institutional memory on day one, without having to write it all manually. Go to Settings → Slack → Postmortem Scan to configure:- Postmortem channel prefixes: channels matching these prefixes will be scanned (e.g.
inc) - Lookback days: how far back to scan, from 7 to 365 days
- Click Scan Now to run immediately, or save to enable periodic scanning
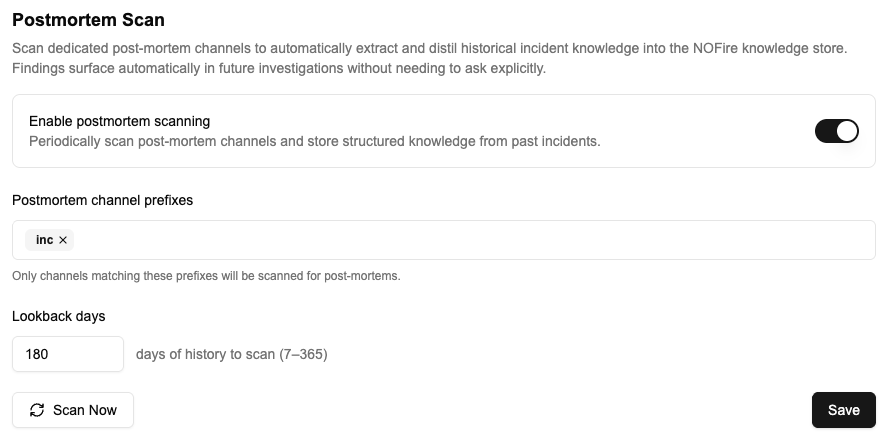
The scan runs in the background and does not affect the channels or their members.
How NOFire adds to it automatically
The library also grows on its own. After completed investigations, NOFire captures confirmed root causes and useful patterns, and stores them in the library. You can review and remove any auto-generated entries from the library at any time.Next steps
Incident channel monitoring
NOFire can watch your incident channels and start investigations automatically
Root cause analysis
See how NOFire uses your knowledge during investigations