

What You Get
A clear answer, not raw data
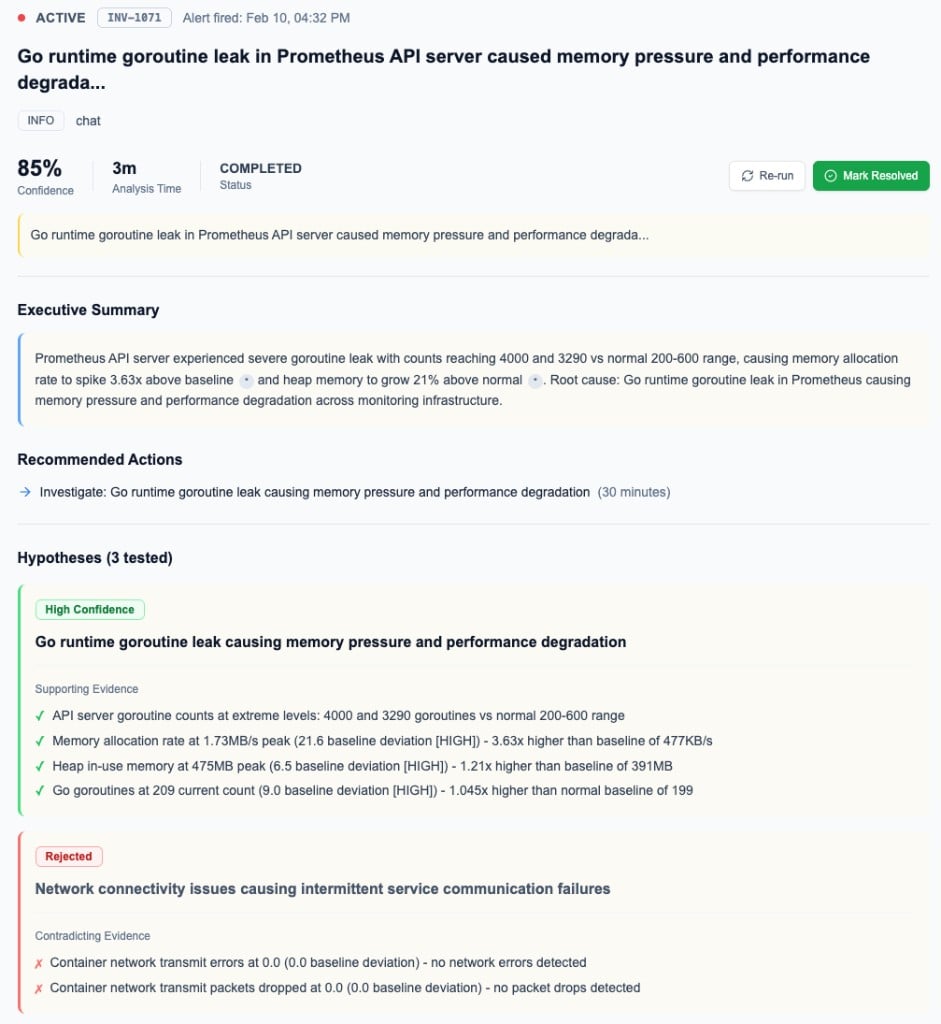
You get an explanation: what broke, why, and what changed before it happened.
Everything checked at once
NOFire queries metrics, logs, traces, infrastructure events, and code changes. You don’t have to open each tool.
Code change correlation
Recent PRs and commits are automatically fetched for the incident window. File hotspots with incident history are highlighted.
Sequence of events
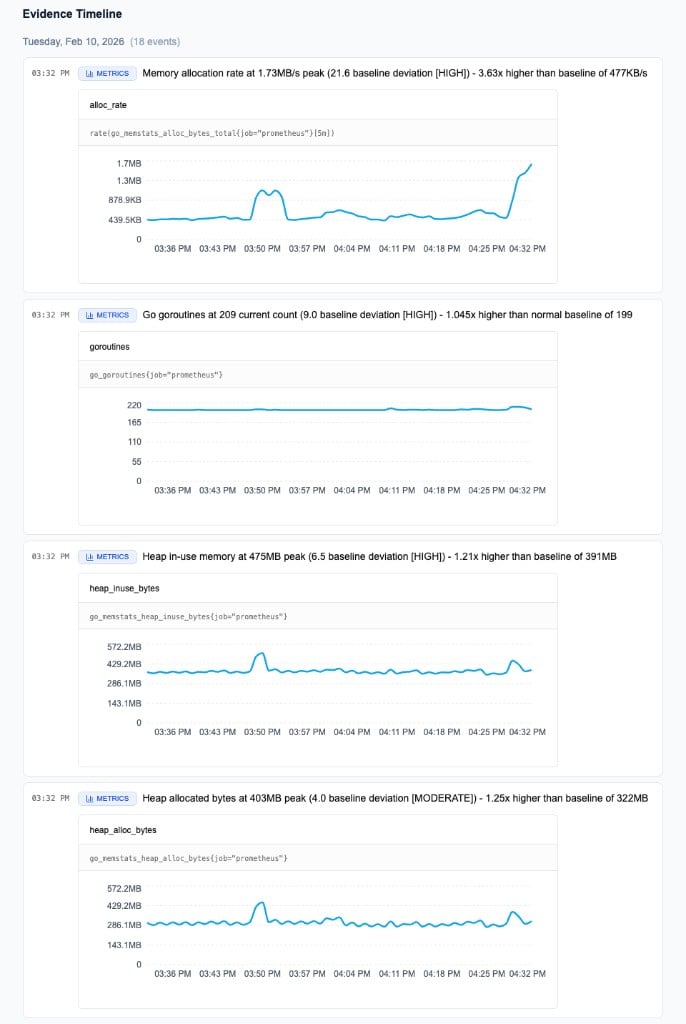
See the chain of events that led to the failure: config change, pod restart, error spike.
How to Use It
Ask in plain language. NOFire pulls from every connected source automatically.Before and After
- Incident: something just broke
- Developer: my deploy looks off
Without NOFire
- Alert fires
- Open Grafana. Metrics spiking, no obvious cause
- Dig through Loki. Hundreds of log lines
- Open Jaeger. Find slow traces, try to correlate
- Check infrastructure events. Spot a pod restart
- Search GitHub. Find the deployment that happened before
- 45+ minutes later: root cause identified
- Alert fires. Ask
why is checkout erroring? - NOFire checks metrics, finds error logs, spots a pod OOMKill, ties it to a deployment 10 min prior, pulls the PR diff
- Response: “checkout started erroring at 14:32 after a deployment at 14:22. The new version increased memory consumption via a changed query in
checkout/db/queries.py, causing pods to be OOMKilled. 3 of 5 replicas are down.” - Minutes to root cause, clear next action
What NOFire Checks
For every investigation, NOFire queries all connected sources:- Metrics: error rates, latency, saturation, resource usage
- Logs: error patterns, stack traces, frequency changes
- Traces: slow spans, error propagation across services
- Infrastructure events: pod restarts, deployments, scaling, config changes
- Code changes: recent PRs and commits, changed files, file hotspots with incident history
- Dependencies: which downstream services were affected
Common Use Cases
On-call: something just broke
On-call: something just broke
Start broad and let NOFire narrow it down.Then follow up:
Was it a code change?
Was it a code change?
Postmortem: build the timeline
Postmortem: build the timeline
Multiple services failing at once
Multiple services failing at once
Available in
- Slack:
@NOFire AIin any channel - Chat dashboard: my.nofire.ai
- IDE (MCP): investigate while coding
Getting Started
1
Connect your sources
RCA works best when metrics, logs, traces, and infrastructure events are all connected. Connect Grafana →
2
Connect GitHub
Code-aware investigation requires VCS access. Connect GitHub →
3
Install NOFire Edge
Edge provides Kubernetes events and service dependency data. Install Edge →
Change Management
See what changed before the incident
Alerts
Understand alerts when they fire, clean them up when they don’t