

Infrastructure Costs
Spend breakdown
See costs by service, team, environment, or region. No BI tools needed.
Spike detection
When costs jump unexpectedly, NOFire identifies what changed and which resources are responsible.
Over-provisioned resources
Find EC2, RDS, and other resources that cost more than their actual usage justifies. Rightsizing recommendations included.
Unused resources
Unattached EBS volumes, idle load balancers, orphaned resources that are costing money doing nothing.
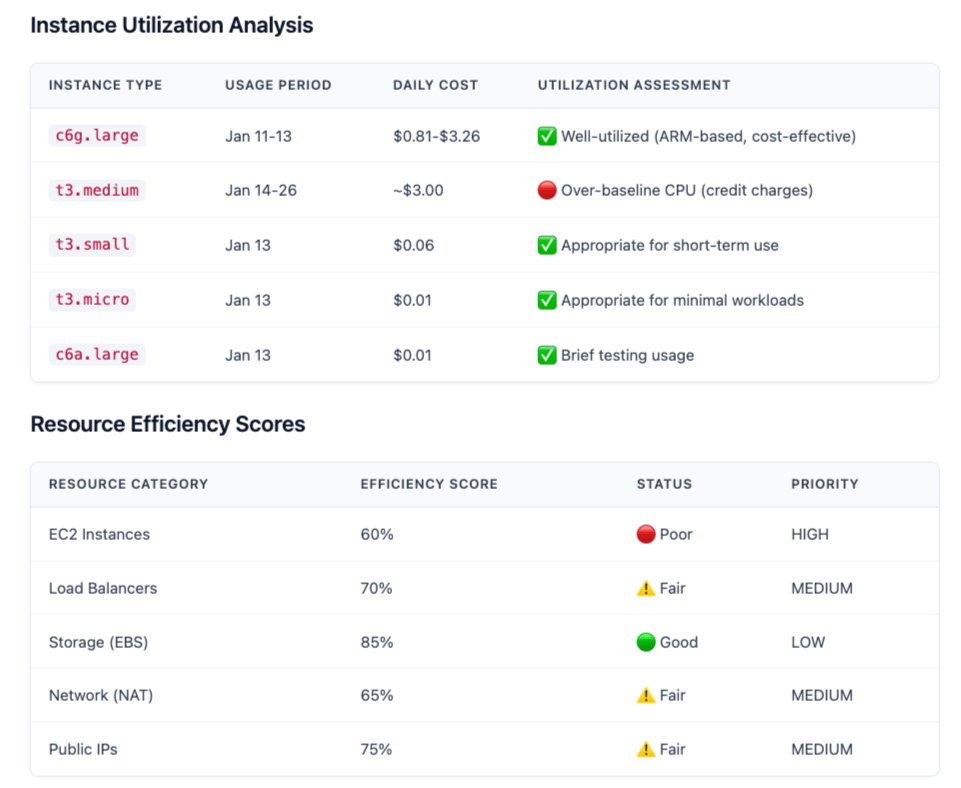
How to use it
Observability Costs
Prometheus, Grafana Cloud, Elastic, and similar tools charge by volume. NOFire analyzes your actual telemetry usage and finds what you’re paying for but not using. Typical impact: 20-30% of observability spend is optimizable overhead.Unused metrics
Metrics that are collected and stored but never queried in any dashboard or alert rule.
High-cardinality labels
Label combinations that explode your time series count and drive up costs.
Log volume hotspots
Services producing excessive log volume: debug logs in production, verbose libraries, redundant entries.
Trace sampling
Where you’re over-sampling (paying for traces nobody looks at) or under-sampling (missing issues).
How to use it
Common Scenarios
Observability bill too high
Observability bill too high
Prometheus cardinality explosion
Prometheus cardinality explosion
Annual tooling review
Annual tooling review
Unexpected AWS bill
Unexpected AWS bill
Available in
- Slack:
@NOFire AIin any channel - Chat dashboard: my.nofire.ai
- IDE (MCP): quick cost checks while coding
Getting Started
1
Connect AWS
For infrastructure costs. Requires read-only IAM access and Cost Explorer enabled. Connect AWS →
2
Connect your observability tools
For observability cost analysis. Connect Grafana →
3
Ask your first question
Start broad:
@NOFire AI where are we overspending?