

Live metric panels are available in the Chat dashboard at my.nofire.ai. Slack and MCP return text-based health summaries.
What You Get
Live panels in chat
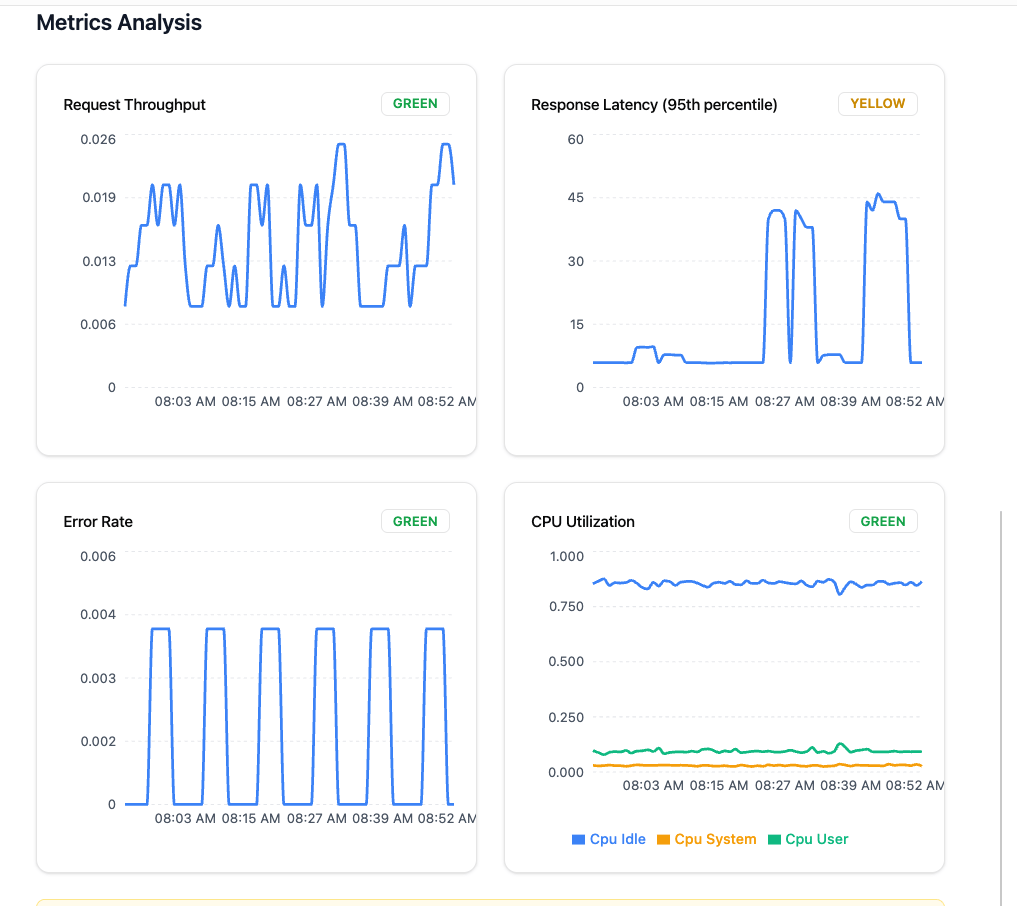
Metric panels render inline: throughput, latency, error rate, and CPU, each with a GREEN / YELLOW / RED status.
Any service, any time window
Ask about any service and any time range. NOFire queries your connected metrics sources and renders the view.
Status at a glance
Health indicators on each panel so you can spot what needs attention immediately.
Jump into investigation
See something off? Ask about it in the same thread and NOFire switches into investigation mode.
How to Use It
In the Chat dashboard at my.nofire.ai:Follow Up in the Same Thread
After seeing the panels, keep going:Common Use Cases
Health check before deploying
Health check before deploying
On-call handoff
On-call handoff
Verify a deployment is clean
Verify a deployment is clean
Start an investigation from a metric
Start an investigation from a metric
See a YELLOW or RED panel and follow up:NOFire goes from health view into full root cause analysis.
Getting Started
Connect at least one metrics source.Connect Prometheus
Self-hosted Prometheus
Connect Grafana
Grafana with Prometheus datasource
Connect Tempo
Distributed tracing
Connect Elasticsearch
Logs and search