

If you run a self-hosted Grafana instance, NOFire AI can connect through an AWS VPC PrivateLink. This keeps all traffic within your network boundary and follows AWS security best practices.
Prerequisites
- A Grafana stack, and permission to create a service account in it.
- The URL of your Grafana stack, for example
https://acme.grafana.net. - A Prometheus datasource that exposes metrics for the services you want mapped. Without them, NOFire AI can read the datasource but cannot map how your services depend on each other.
Step 1: Setup Grafana stack integration
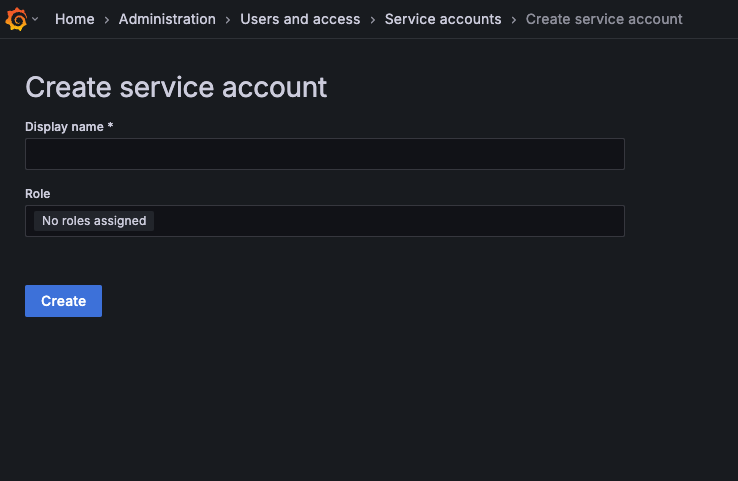
- Sign in to your Grafana instance and navigate to Service Accounts.
\
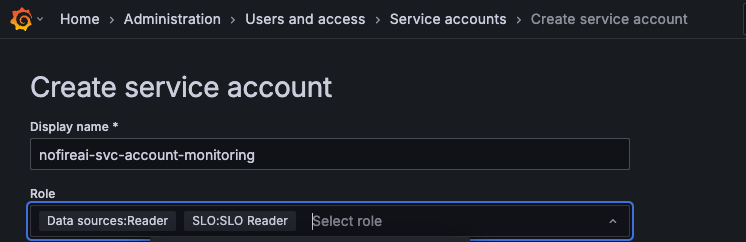
- Select the following roles: Datasource Reader, SLO Reader (Grafana Cloud-only)
Step 2: Add Grafana connection to NOFire AI
-
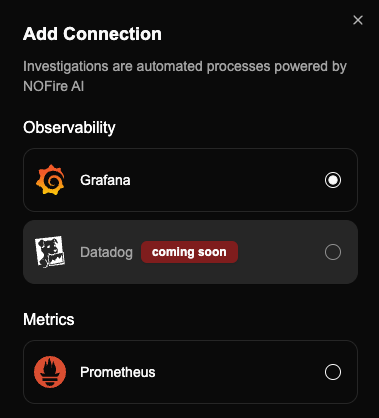
In the NOFire AI dashboard, go to Connections and click Connect on Grafana.
-
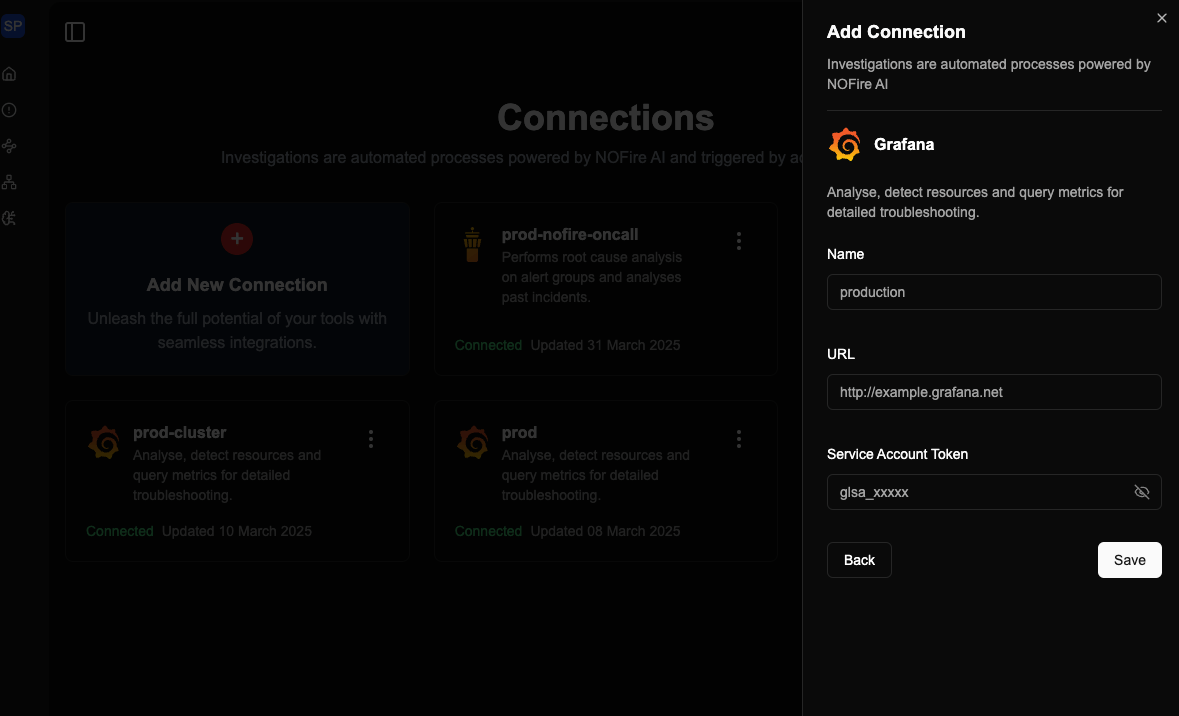
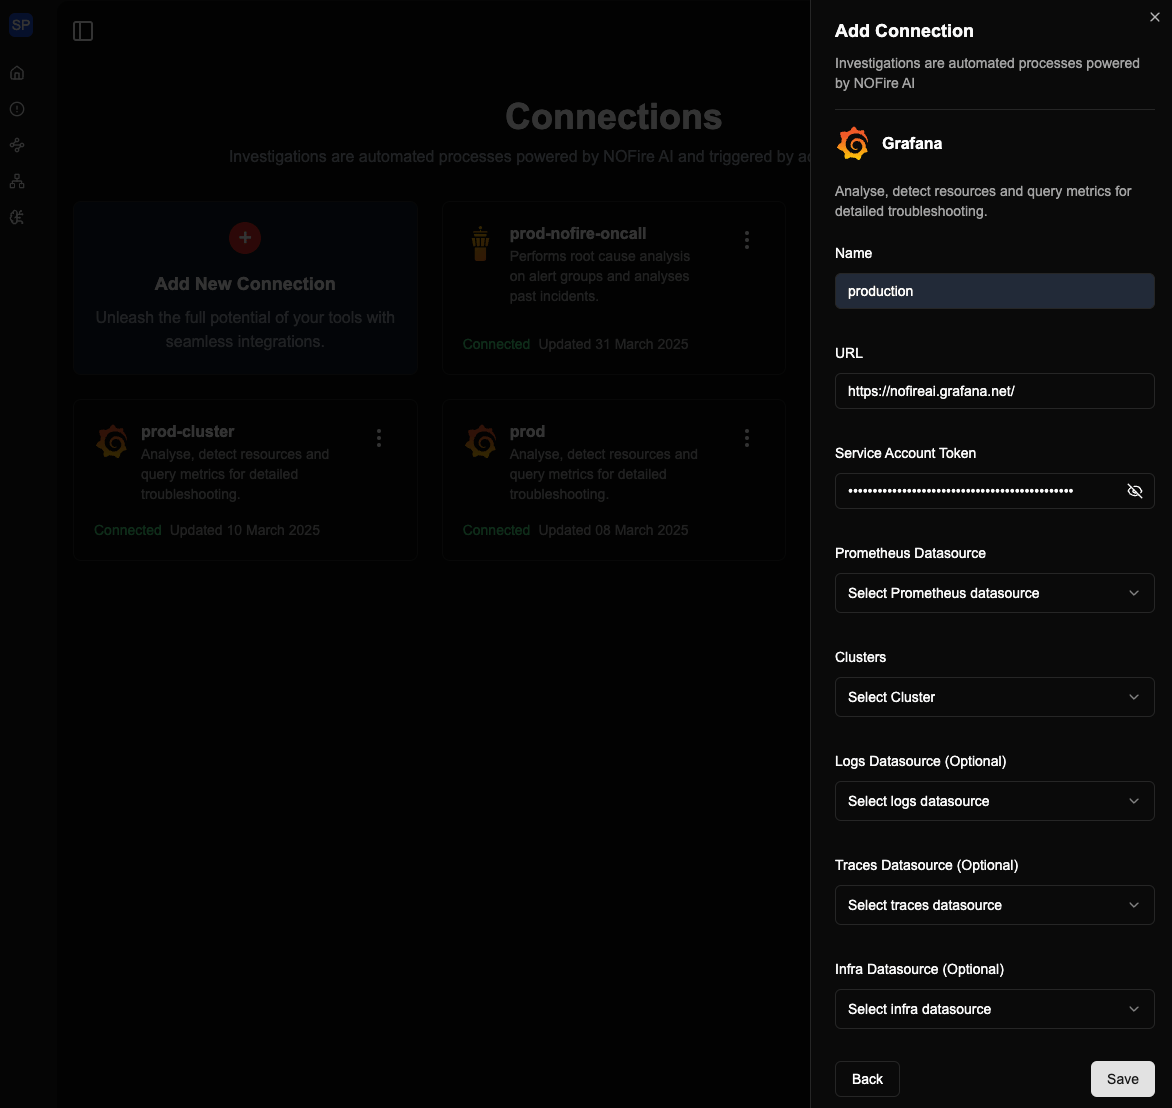
Enter credentials:
- Name (for example, production)
- URL (for example,
http://example.grafana.net) - Service Account Token (from Step 1)
-
Select the datasources:
- Prometheus Datasource
- Clusters: select the cluster that this connection covers.
- Logs Datasource (Optional)
- Traces Datasource (Optional)
Test the connection
- Open the Connections dashboard and make sure that the Grafana connection status is READY. A connection that stays in an error state did not authenticate.
- Ask NOFire a question that needs metrics, for example “what is the error rate for the checkout service right now?”. An answer that cites your metrics confirms the connection works end to end.
Troubleshooting
The connection fails to authenticate
The connection fails to authenticate
The service account token is wrong, expired, or belongs to a different stack. Create a new token in Grafana and edit the connection to use it.
No datasources appear after you click Save
No datasources appear after you click Save
The service account is missing the Datasource Reader role. Add the role in Grafana, then save the connection again.
NOFire answers without metrics
NOFire answers without metrics
The datasource exposes no metrics for those services. Check your scrape configuration covers them.